Custom Pattern Detector Indicator
Summary
This indicator lets you define your own custom pattern instead of the typical candlestick patterns. Everybody already knows about common candlestick patterns like the Doji pattern.
This indicator is different though. The pattern you will define is a custom pattern based on CANDLE FORMATIONS.
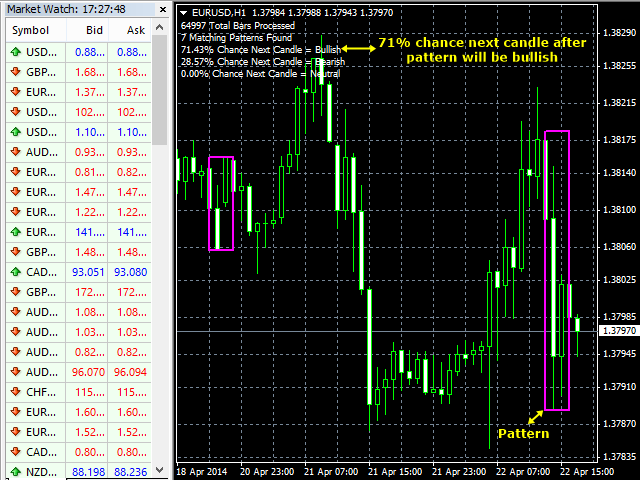
Once the indicator knows the pattern you want it to look for, then it will go through history on the chart and find matching patterns, make them visible to you, and calculate statistics.
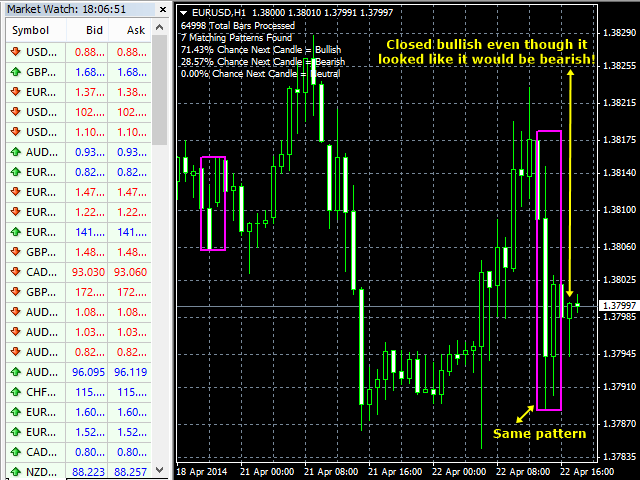
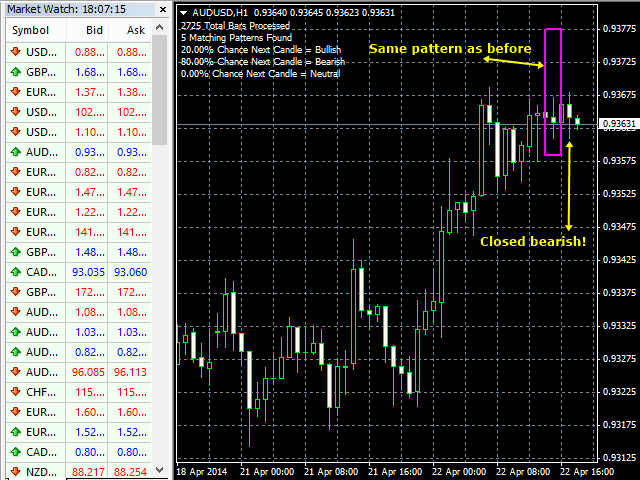
These statistics include the percentage of bullish and bearish candles that immediately followed the pattern. So the user will have a statistical advantage in knowing what type (eg. bullish or bearish) the next candle will be and can trade accordingly.
Benefits / Possible Uses
- It can be used as a supplement to an existing trading system. For example, only placing a buy trade if the bullish percentage is above 75% (or some other strong number).
- It can be used as a contrarian signal. For example, if a pattern is leaning a certain direction heavily (eg. bullish 90%) then the next candle may be bearish since the market will try to maintain a 50/50 ratio of bullish to bearish candles. The same 50/50 ratio may hold true for patterns too.
- It can be used in binary options trading since the statistical outcome of the next candle is known in advance.
- It can be used for your own statistical analysis or record keeping. For example, if you want to make your own EA using a certain reliable pattern.
Inputs
- Shift
This input is used to make the indicator recognize where on the chart it needs to look for a pattern. This is the shift relative to the current open candle.
For example, if set to 1 then the pattern will start on the last closed candle (1 candle ago). This is like a starting point for your pattern. Either this input must be used or the below 'Date & Time'. If both are set at the same time, this input takes precedence.
- Date & Time
This does the same as the 'Shift' input except that you can define the pattern by MT4 date/time instead of a shift.
For example, if you plot a vertical line on the chart, you will see that the line has a date and time on the bottom. This is the same format that this input will use.
So as an example, you could input '2024.03.22 08:30' or something similar. Just keep the format the same with no extra characters or spaces.
Either this input must be used or the above 'Shift'. If both are set at the same time by mistake, the 'Shift' input takes precedence.
- # of Candles (MANDATORY)
This input is used to make the indicator know the duration in candles after the starting point (shift or date/time) that the pattern is.
So if you input 3, this means that the pattern you want to use is 3 candles long. This input needs to be greater than 0.
- Max Upper Tail Deviation %, MaxBody Deviation %, Max Lower Tail Deviation % (OPTIONAL)
These inputs control the maximum deviation allowed in finding patterns.
These inputs are based in percentages and not pips or points. A zero will disable each one. Anything greater than 0 is telling the indicator to be strict in recognizing patterns.
The higher the number for each then the more deviation you are allowing. For example, let's say your pattern has a candle with an upper tail of 100 points and you have the input 'Max Upper Tail Deviation %' set to 50.
You would be allowing a deviation for the upper tail(s) to be 50% bigger/smaller than 100 points. So if a tail was 50 points up to 150 points then it could still be used since it has an allowable deviation.
If you set all 3 inputs to 0 then this is ok too. This would mean that you only care about candle type formations excluding body and tail pips/points.
For example, let's say your pattern consists of 7 candles like bullish-bearish-bearish-bearish-bullish-bullish-bullish. If there is a group of 7 candles like this somewhere else on the chart then this group of 7 candles would be considered a match and included in the statistics.
- Color
This is the color of the boxes drawn by the indicator. Set to 'None' if you wish to see no boxes and just the statistics.
- Width
This is the width of the boxes drawn by the indicator. Set this greater than 0.
Notes
- You must either use 'Shift' or 'Date Time'. There are no other options for telling the indicator where to start on the chart. There is no need to use both. Just use one method. If both are used by mistake, 'Shift' takes precedence.
- This indicator is based on candle formations. For example, a pattern 5 candles in duration like bull-bear-bear-bull-bear. You can further refine the pattern using the percentage inputs.
- This is a LEADING INDICATOR. The whole point of this indicator is to provide you with the statistical probability of what direction the current candle will close at IN ADVANCE. This is why the default setting for shift is 1. So the next candle following the pattern will be the current candle. You can of course use the indicator for other purposes though.
- DLL imports must be enabled for this indicator to work.
Forum
- The official forum to post your comments, questions, concerns, or bug reports about the Custom Pattern Detector Indicator can be found at Forex Zone Forum.
Example
Download
- The current version is v1.20 released on February 27, 2024. Updates will be made based on customer feedback.
- This indicator is FREE with no restrictions! Just use the link below to download instantly.
- Post your questions or feedback on the official Custom Pattern Detector Indicator forum page.
- Please
SHARE
this indicator to support our work!
Instant Download
|